三江平原耕地质量实验报告
本文最后更新于:17 days ago
三江平原三市耕地质量实验报告
作者
大家好,我是东北师范大学2020级吴蒙蔚,这是我大二下空间分析大作业,从4月23日世界读书日开始,到5月1日劳动节,我一直在肝这份作业。
做作业的过程中,书本里抽象的概念变得生动起来,看似轻松的步骤方法,殊不知经历了多少人接力造轮子,不断封装复杂的算法,最后呈现出来简单的接口。弄懂复杂算法的意义在哪里,在于接下来的运用,数值分析课讲到了常微分方程的欧拉法,matlab一行代码可以得到结果,但老师带着我们推了一节课,结果重要吗?方法才是关键,思想才是闪闪发光之处.
摘要
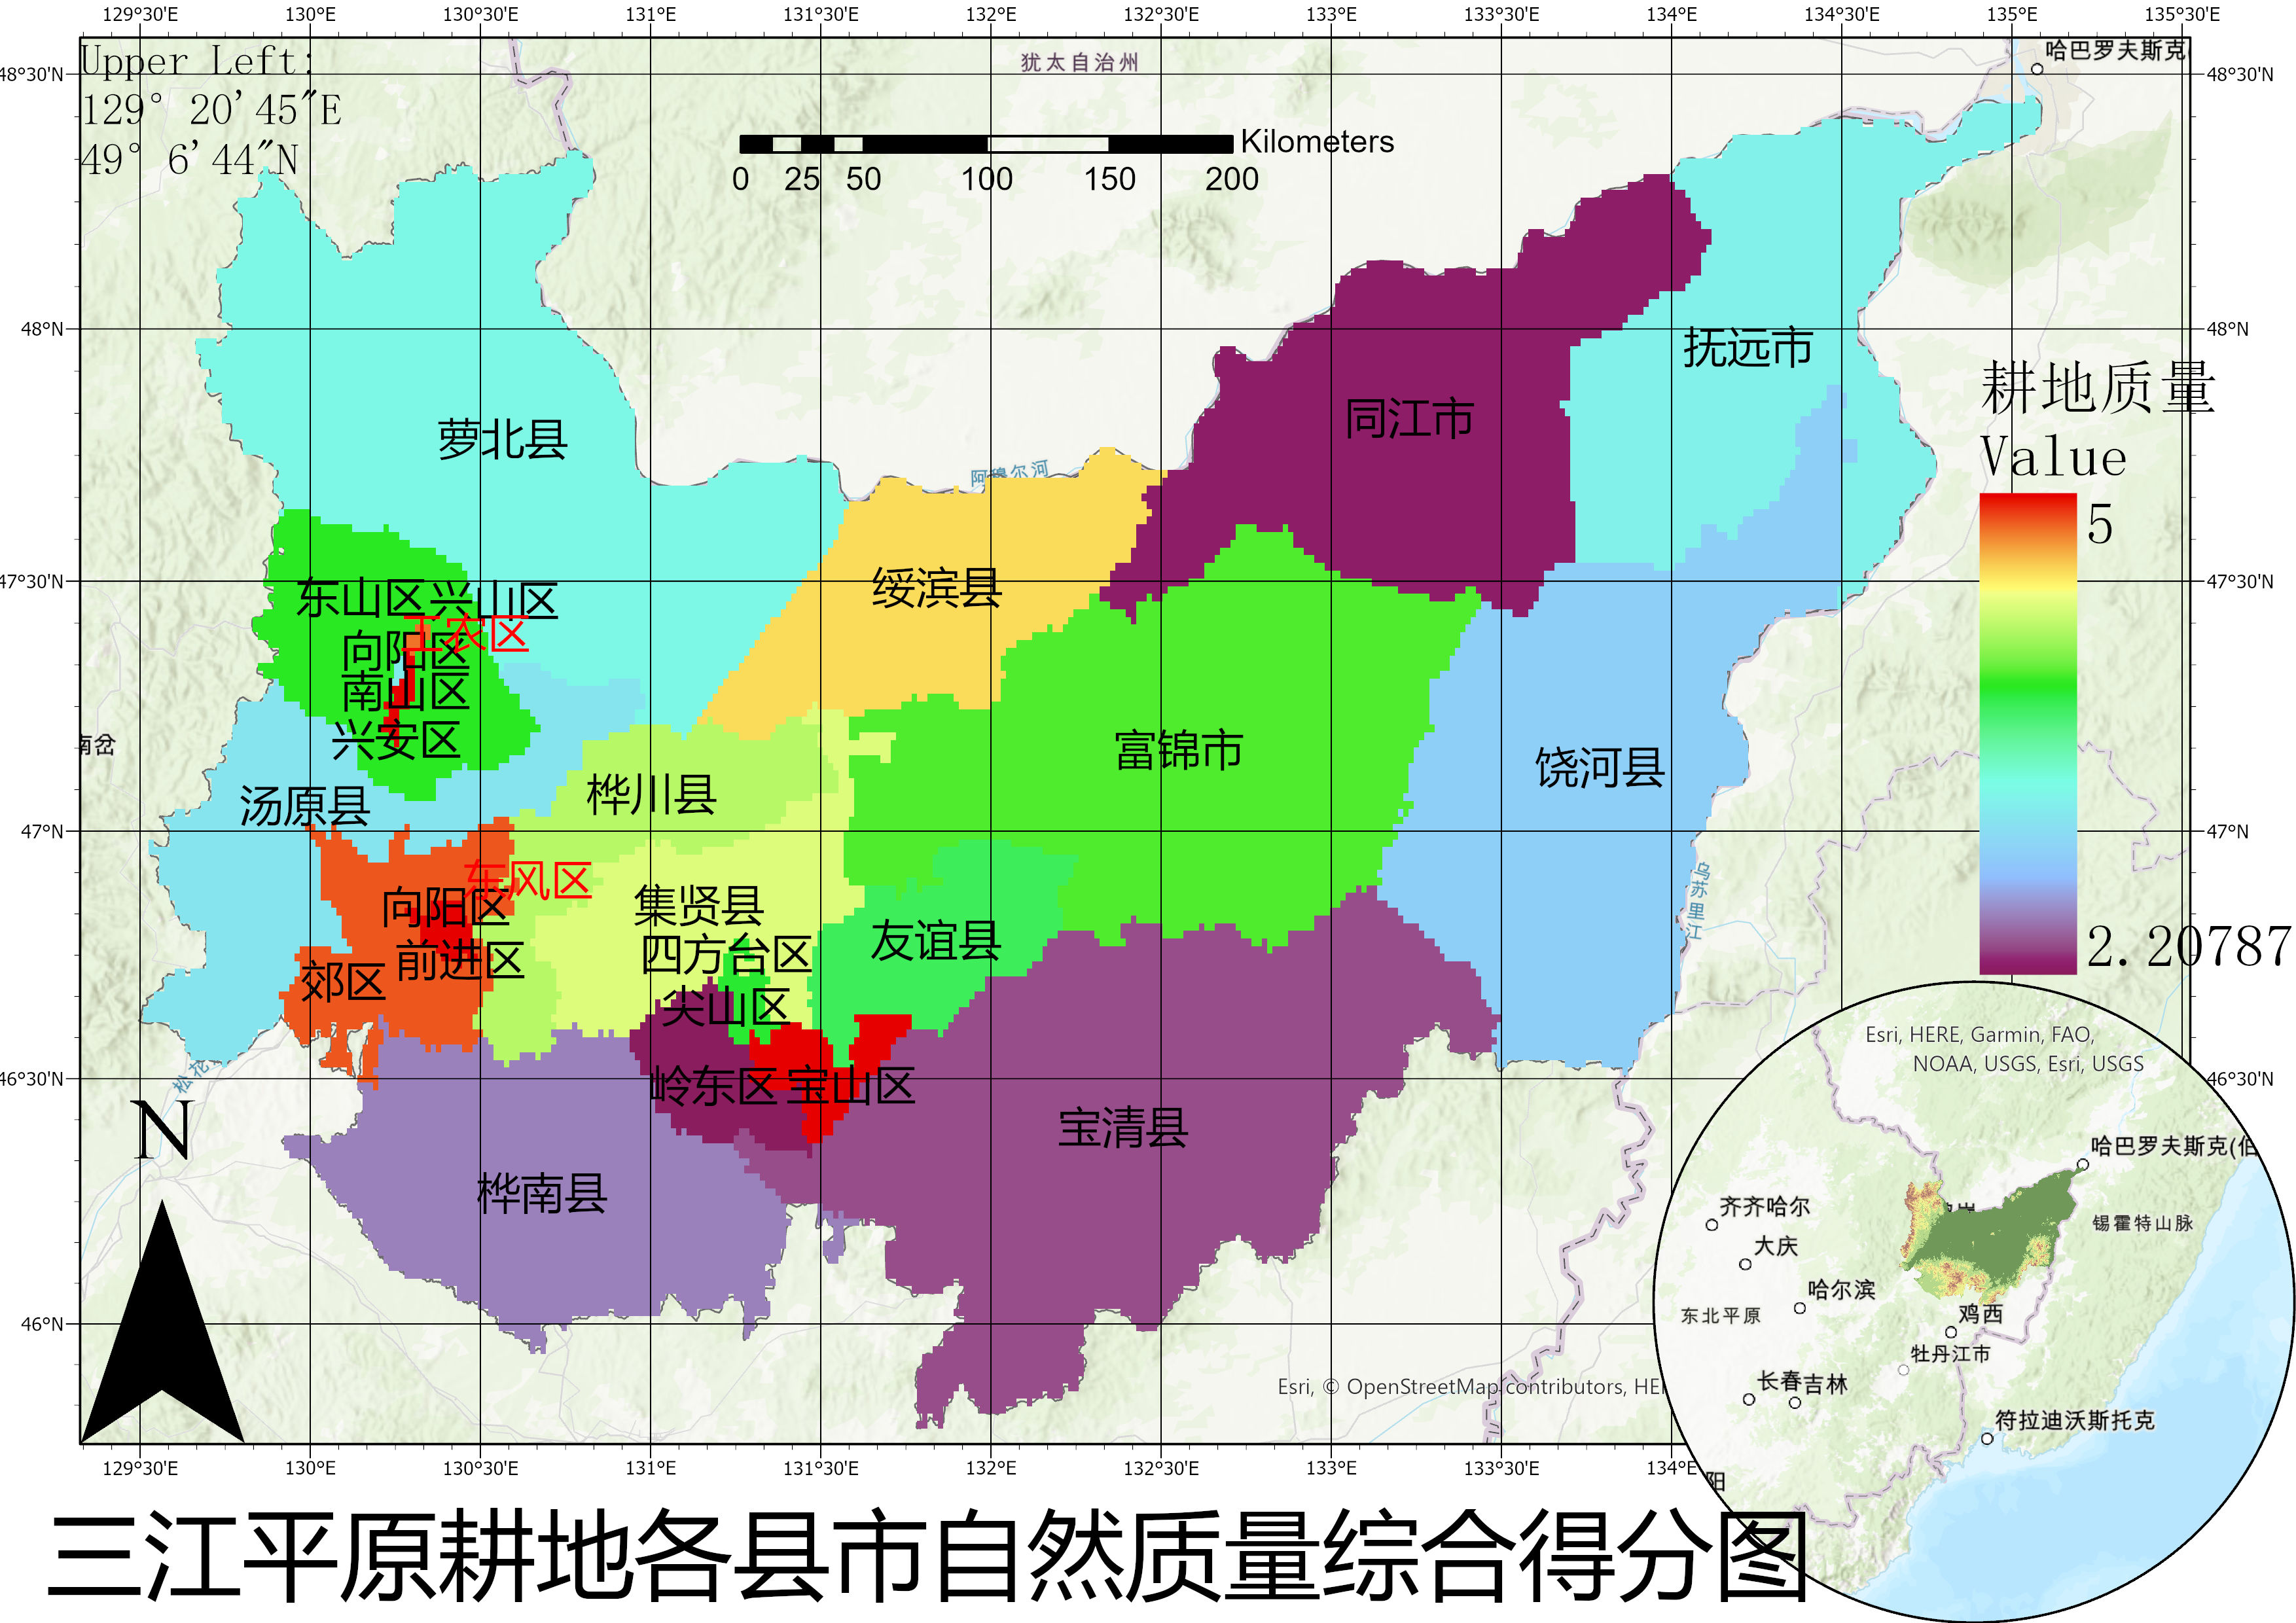
三江平原的耕地质量关乎民生,一份合理的耕地质量得分图有着重要的意义.
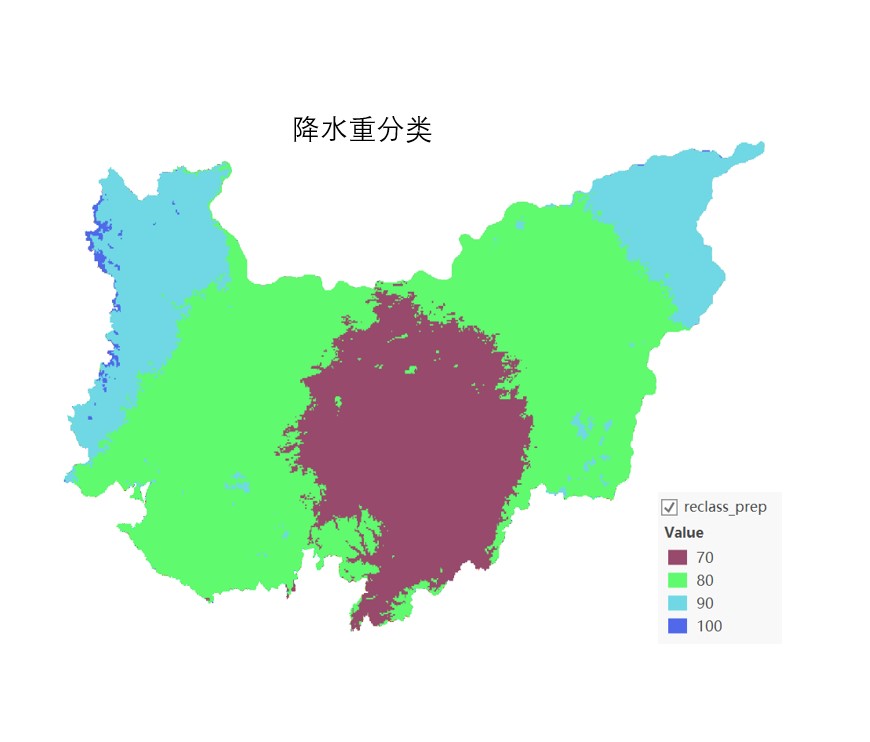
- 首先是设置各个指标的权重:从日常经验来看,积温,有机质,坡度对耕地质量评估的权重应该是高的,分别是0.15,0.2,0.2,我们选择土地去耕作时,也基本就看看是不是温度够,坡度缓,有机质丰富,其实植物生长还需要三大营养素:氮磷钾,这个也是重要的指标,于是权重均为0.1,坡向在东北平原地区并不如丘陵高山地区重要,故设为0.05。最后是降水,因为东北地区整体降水足,和西北缺水地区不同,故其降水权重设为0.1.
- 其次是整理思路:
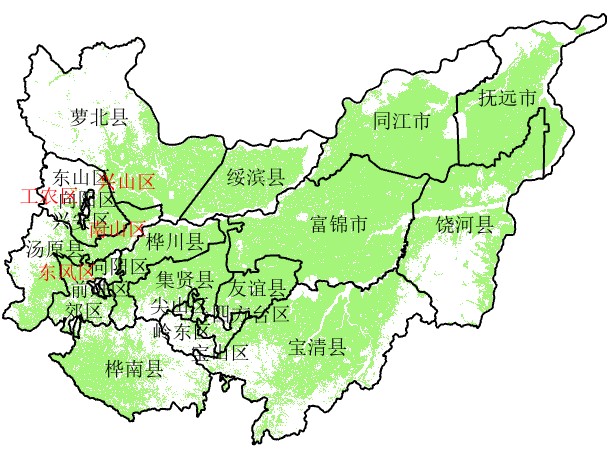
- 我们首先需要什么数据?土壤,积温,降水,地形,土地利用类型。
- 其次是怎么处理?积温是个难题,因为我们得到的WorldClim的数据是月平均气温,如果月均气温低于10,那么这个月的积温不能用30$\cdot$(月平均气温)来替代,应该适当缩小。
- 一共8个指标,需要8个栅格。
- 土壤数据转4次栅格,然后根据分类表重分类可以得到4个指标分数的栅格,
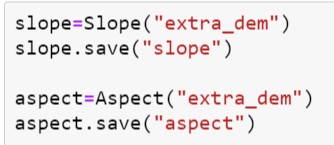
- GDEM地形数据可以得到坡度坡向2个指标分数的栅格。
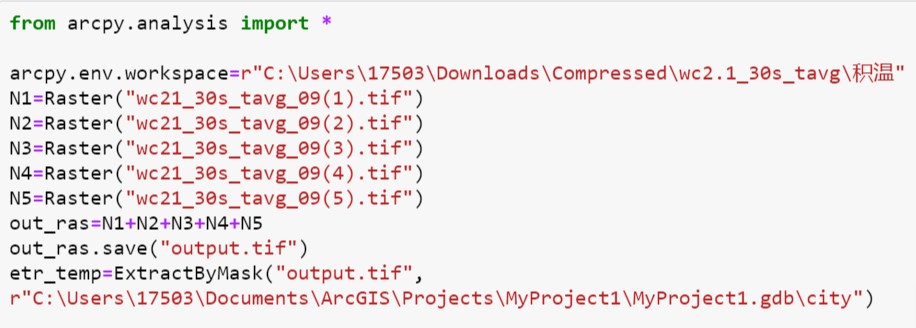
- 降水和积温用栅格计算器得到累积的5个月的降水和积温再按照分类表重分类得到2个指标的得分栅格,
- 最后按照权重将8个指标加起来,得到总的质量。
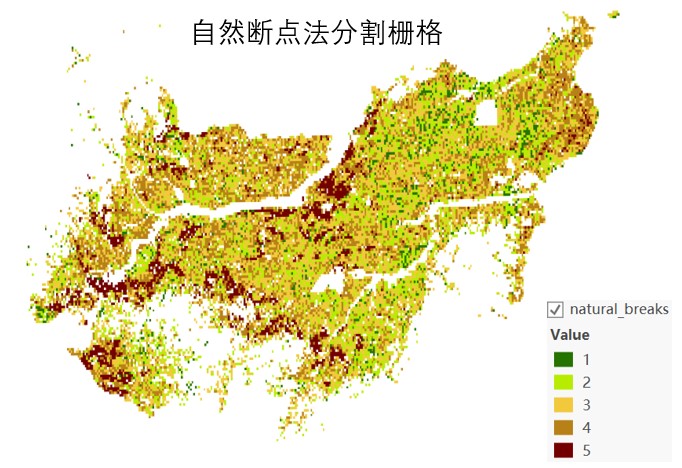
- 然后通过土地利用图提取出耕地的质量得分,再运用分割栅格的自然断点法得到5级土地,分区统计得到各县市的耕地质量得分。
- 最后提高分辨率:重采样,得到100m的栅格数据
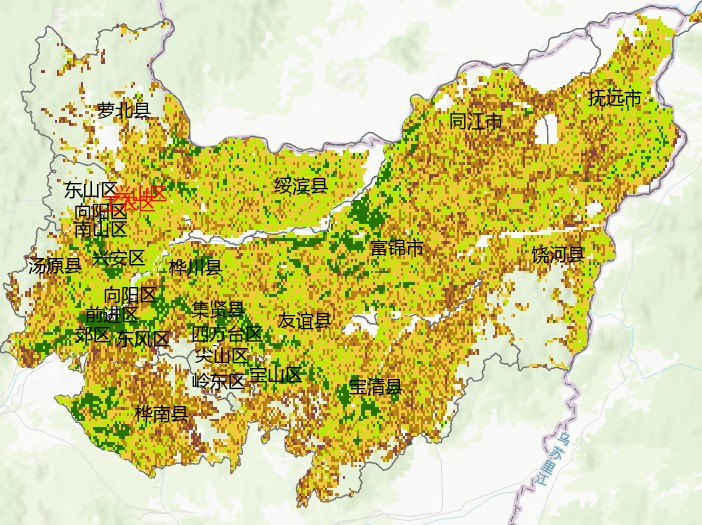
研究区:
双鸭山市,佳木斯市,鹤岗市
数据来源:
1. NASA earthdata,用来查找GDEM数据
- IDM下载器下载
- 举例:N47 E132条带的GDEM数据 https://data.lpdaac.earthdatacloud.nasa.gov/lp-prod-protected/ASTGTM.003/ASTGTMV003_N47E132_dem.tif
(更改N,E后面数字可以获取其他经纬度的影像)
2. Worldclim
2010-2018年各月降水 ,各月平均温度3. 行政区数据来源
因为是2021年9月下载的,所以不知道来源,这是文件——谷歌云盘地址4. 土壤数据
由郭笑怡老师提供——[谷歌云盘地址](侵删)(https://drive.google.com/file/d/1koLqOBiK6T_KUlUT7OzyhThgSBR4HV19/view?usp=sharing)5. GlobaLand30数据
所用条带:N52_45,N53_45
数据处理分析工具:Arcgis pro
数据处理方法:
Extract by Mask

FeatureclassToFeatureclass


Extract By Attribute

降水处理


土壤处理


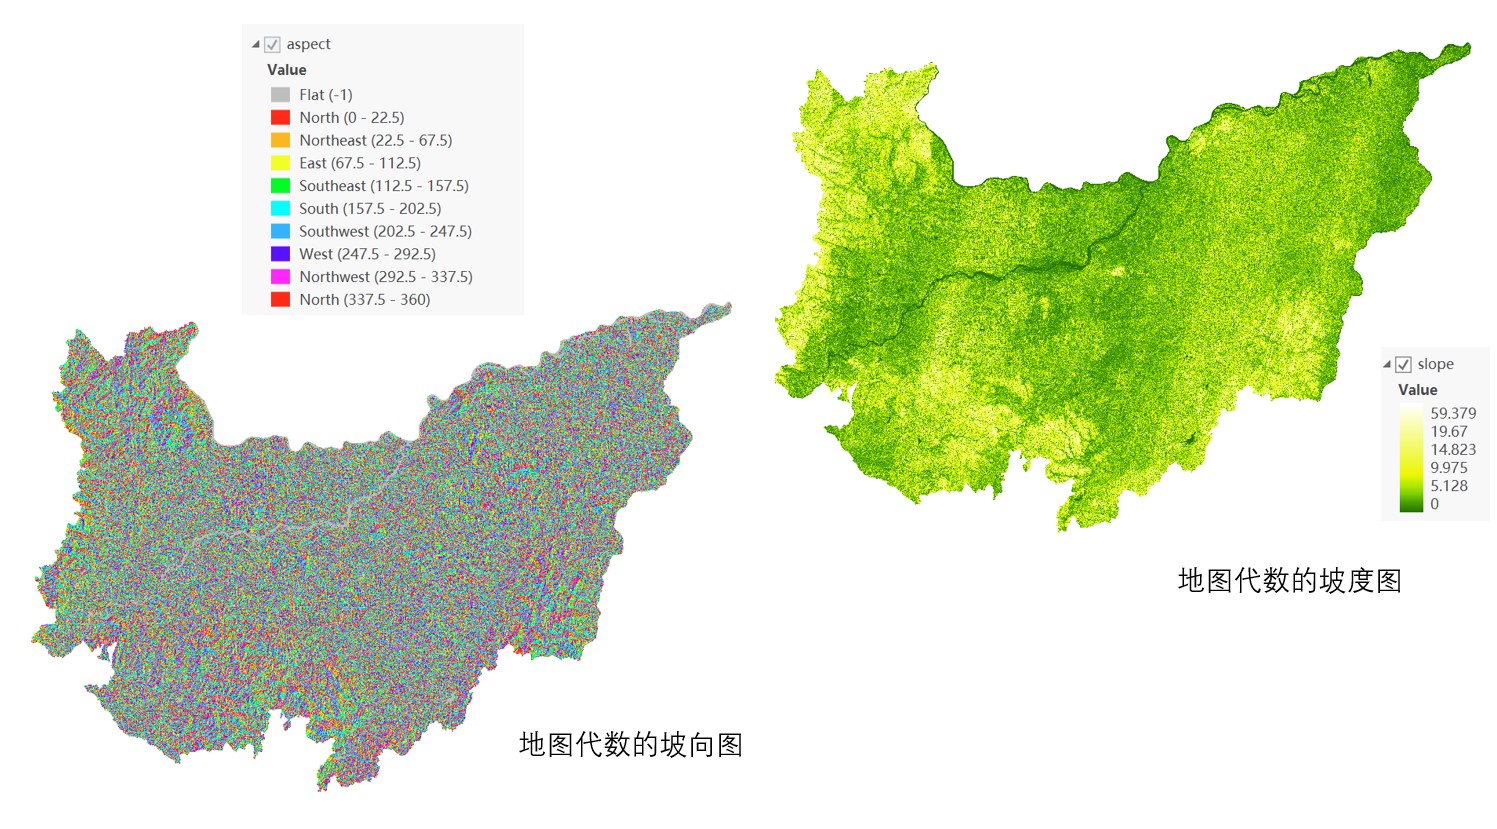
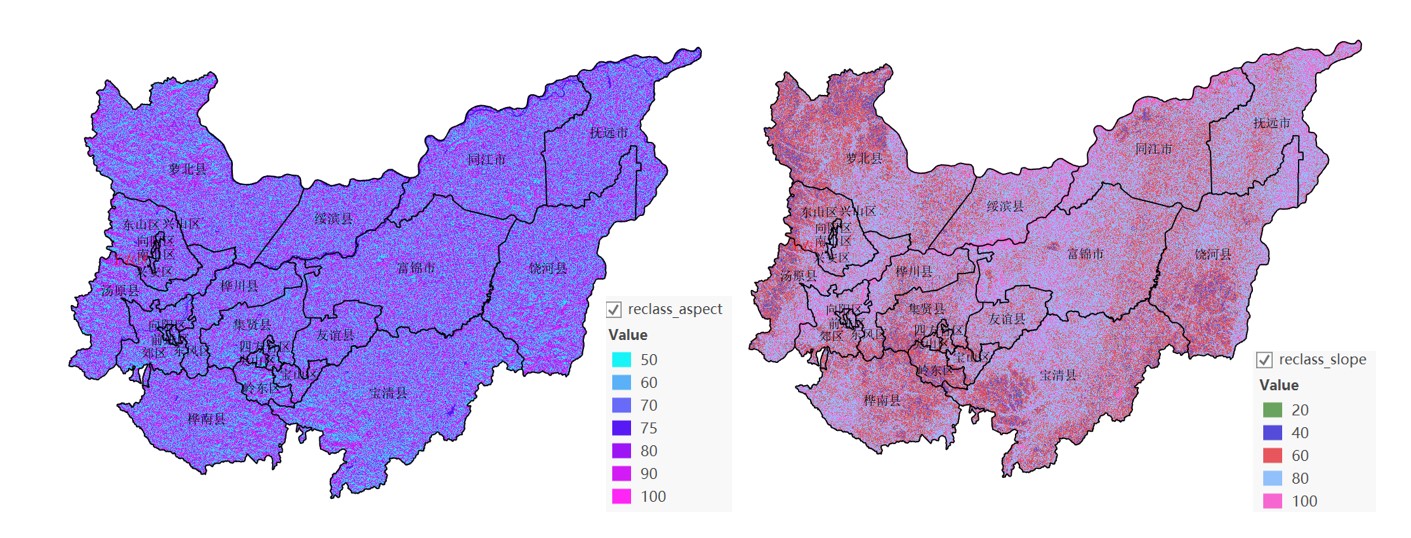
坡度坡向
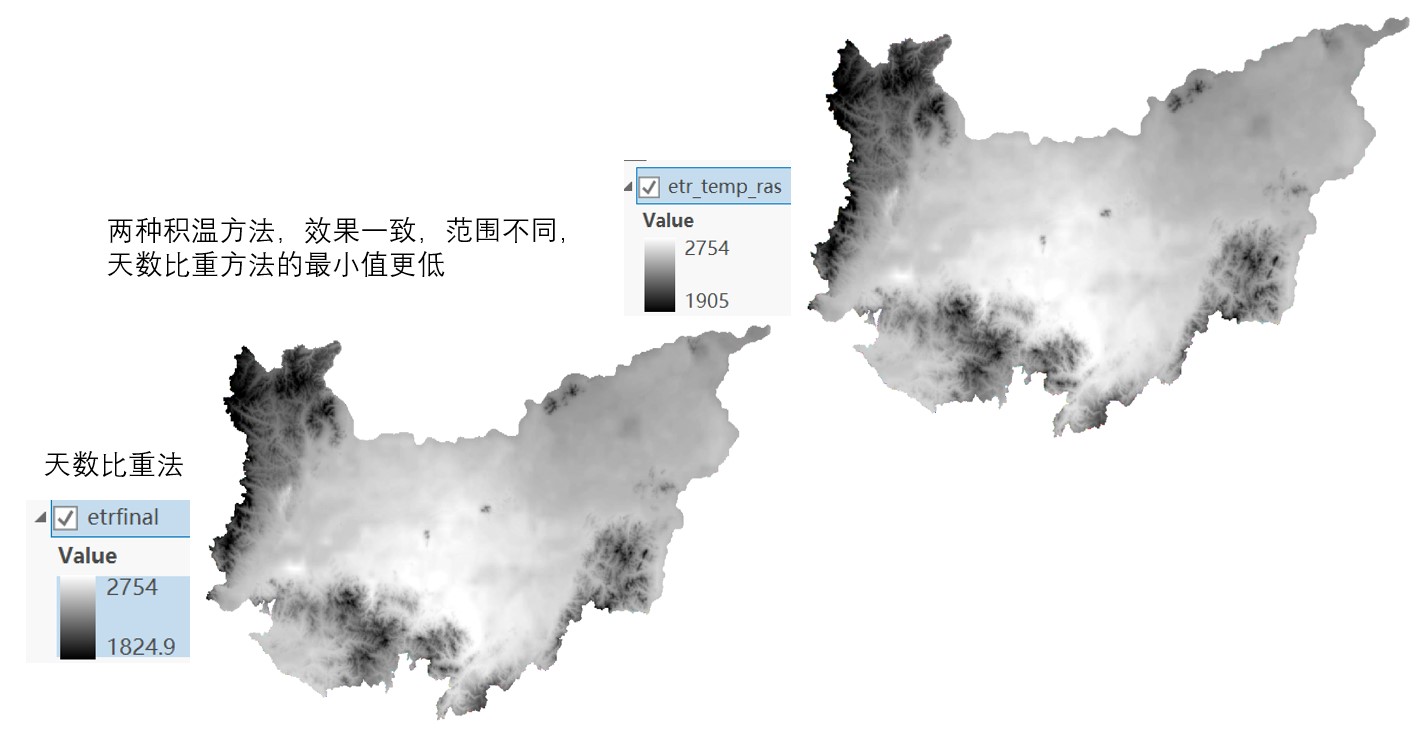
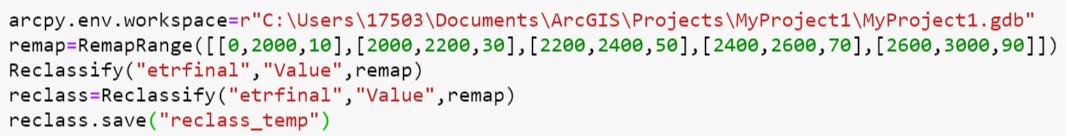
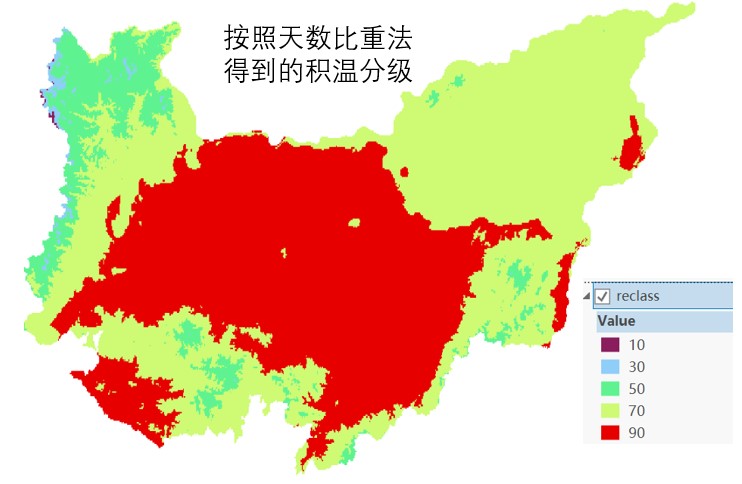
积温初步方法
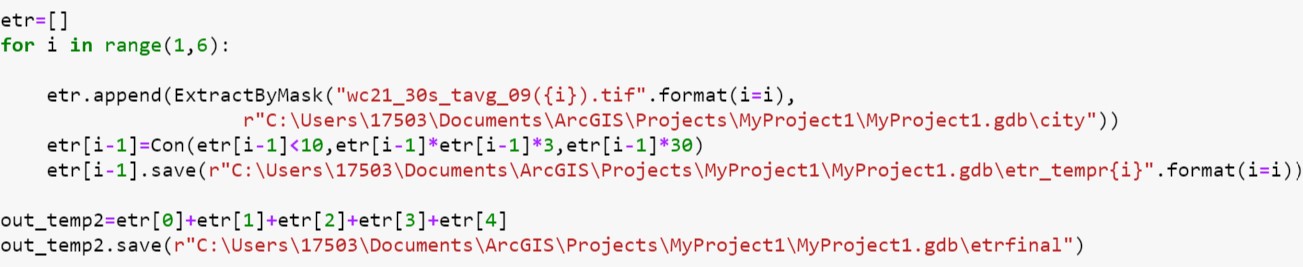
积温天数比重法
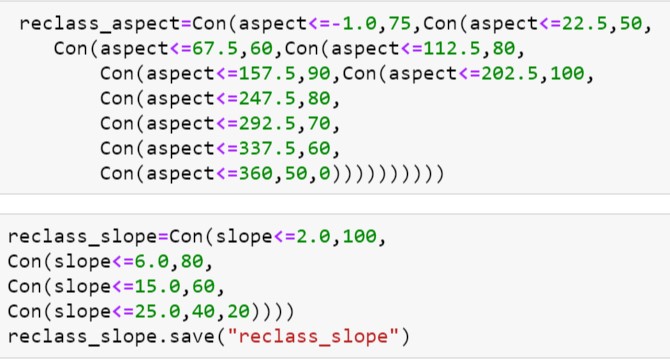
重分类坡度坡向
| 范围重分类 | 语法 |
|---|---|
| Remap range 帮助 | RemapRange (remapTable) |
| remapTable | 参数 | 说明 |
|---|---|---|
| [[startValue, endValue, newValue],…] | 用于将旧值(按范围指定)重映射为新值的重映射表。 |
| 有机质/% | 全氮/% | 全磷/% | 全钾/% | 坡向 | 坡度 | 积温 | 降水 |
|---|---|---|---|---|---|---|---|
| [-1,0,75] | |||||||
| [247.5,292.5,70] | |||||||
| [292.5,337.5,60] | |||||||
| [337.5,360,50] | |||||||
| [0.5,100,100] | [202.5,247.5,80] | ||||||
| [0,2,40] | [0,0.1,50] | [0,0.05,40] | [0,1.5,40] | [0,22.5,50] | [0,2,100] | [0,2000,10] | [0,450,70] |
| [2,4,50] | [0.1,0.2,60] | [0.05,0.07,50] | [1.5,1.9,50] | [22.5,67.5,60] | [2,6,80] | [2000,2200,30] | [450,500,80] |
| [4,6,60] | [0.2,0.3,70] | [0.07,0.1,60] | [1.9,2.1,70] | [67.5,112.5,80] | [6,15,60] | [2200,2400,50] | [500,550,90] |
| [6,8,80] | [0.3,0.4,80] | [0.1,0.15,80] | [2.1,2.5,80] | [112.5,157.5,90] | [15,25,40] | [2400,2600,70] | [550,1000,100] |
| [8,100,100] | [0.4,0.5,90] | [0.15,100,100] | [2.5,100,100] | [157.5,202.5,100] | [25,90,0] | [2600,4000,90] |
加权求总体质量得分
自然断点法分割栅格
Jenks natural breaks optimization seems to be one dimensional k-means
There are two steps that must be repeated:
- Calculate the sum of squared deviations from the class means (SDCM).
- Choose a new way of dividing the data into classes, perhaps by moving one or more data points from one class to a different one.
New class deviations are then calculated, and the process is repeated until the sum of the within class deviations reaches a minimal value.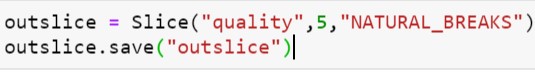
分区统计


重采样

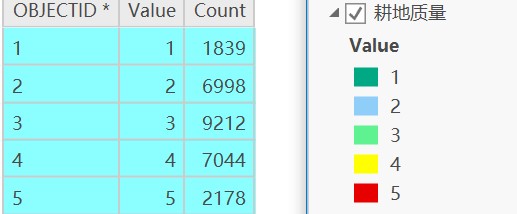
计算权重
| OBJECTID | Value Count | Weight |
|---|---|---|
1 级土地|1839|0.07
2 级土地|6998|0.25
3 级土地| 9212|0.34
4 级土地 | 7044|0.26
5 级土地 | 2178|0.08
未解疑问
用栅格计算器的条件函数反复嵌套来重分类坡度坡向,笨拙但有用且不失优雅,反而reclassify坡度坡向时,会报错,下面就是报错,我累了,我还是不知道为啥不能重分类
1 | |
ERROR 000628: Cannot set input into parameter in_raster.
代码流程
1 | |
结果